Enabling DCI.DbC on a Jasper Lake NUC
Table of Contents
A story about hacking on UEFI firmware for Intel platforms.
Most of the things we're talking about here are fundamentally unsafe, and there are no guarantees that your machine won't be irrepairably damaged while trying to reproduce any of this.
Furthermore, please be aware that all of the steps taken here are only relevant to the exact state of my device [described later in the article], which might be different from yours.
Setting Up the Stack
I thought it might be fun to experiment on my NUC11ATKC4. This NUC is from Intel's "Jasper Lake" family, and the Celeron N5105 inside has four of the "Tremont" cores.
After booting it up for the first time, I was disappointed by the limited options exposed in the BIOS setup menu. But lo and behold, after a second glance, there was at least one interesting option:
Debug Interface
Enables or Disables IA32 silicon debug features.
Disappointingly [but unsuprisingly], enabling this option in the setup menu didn't immediately appear to do anything interesting! So in spite of this, I thought it might be fun to dig a little deeper. What does it take to enable these features on a platform where the BIOS setup menu isn't sufficient?
Important Context
Intel has an article1 which gives a high-level description about hardware debugging access and capabilities. On top of that, the datasheet2 for this part mentions a couple different features, and also describes some of the different interfaces that expose debug signals.
These give us a lot of useful context, so before we start tinkering, let's review what little documentation we have and try to come up with a rough plan.
RTFM: Debug Interface?
It took me a moment to recognize that the "Debug Interface" option in our
BIOS setup menu probably refers to the IA32_DEBUG_INTERFACE MSR.
When we look at the Intel Software Developer's Manual, we find
that the language is pretty much the same:
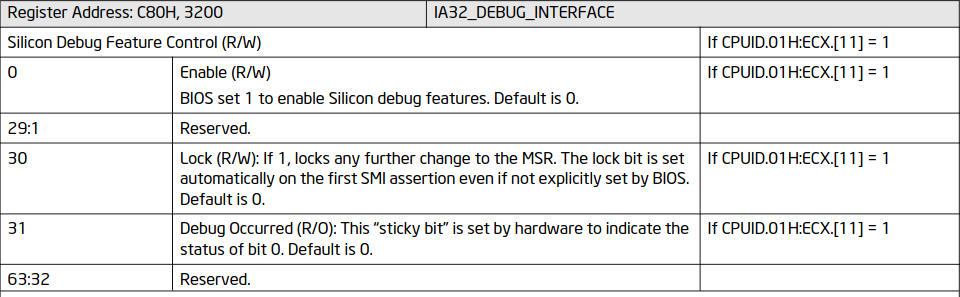 Figure 1. Description of the
 IA32_DEBUG_INTERFACE MSR from the Intel SDM.
While searching around about this, I thought that this tweet by Mark Ermolov probably paints the most comprehensive picture. Apparently [at least on whichever platform he's referring to], interactions with this MSR are implemented with microcoded accesses on a "debug consent" register associated with something called the "DFx security aggregator".
The Intel article goes into some details about this, which I've taken the liberty of rephrasing slightly here to make it somewhat clearer:
The State Aggregation and Privilege Generation feature brings together the aggregated state of the product and determines the necessary protection needed.
The state consists of whether the product is in the Production lifecycle state as opposed to the Silicon Manufacturing or Platform Manufacturing lifecycle states and if the entity performing the debug has authenticated and/or unlocked.
This information is processed by the associated logic, and the entity’s privilege is determined. The entity’s privilege consists of the debug security policy (or "what secure assets should be protected") and the debug capabilities being enabled (or "what debug capabilities are enabled based on the authentication and unlock state").
This is a fundamental feature of the Intel® Debug Protection Technology and is internally known as the “DFx Security Aggregator”.
As far as I can tell, our situation looks something like this:
-
IA32_DEBUG_INTERFACEis a way for system software (in our case, the BIOS) to control access to debug features exposed during runtime -
This is totally independent of the underlying security policy and capabilities that are available (which is determined by the state of fuses, the prescence of certain keys, etc)
-
This doesn't necessarily have anything to do with control over the configuration of other parts of the system that might be required to support all of the available hardware debugging capabilities that might be enabled
I took this to mean that even if IA32_DEBUG_INTERFACE indicates
consent from system software for enable some debugging features, we're
probably going to need to configure some other aspects of the machine before
anything interesting happens.
RTFM: Debugging Capabilities?
I'm operating under the assumption that this platform is not "unlocked" in any meaningful way, and that it's reasonable to assume that features on our part falls under the "Public" protection class described by that Intel article.
It seems like this should amount to at least some limited form of JTAG access to the machine, which includes control over the CPU cores and maybe some kind of system tracing features.
The term "run control" apparently refers to mechanism used to control the x86 cores exposed via JTAG. As far as I can tell, this involves placing the core in a special "probe mode" which allows us set breakpoints, single-step through execution, and interact with the architectural state. This is probably what we'd be dealing with, although the exact details aren't clear to me yet.
I think it would be really cool to try this out. But of course, even if we manage to enable some debugging features, there's no guarantee that we'll actually be able to use them in any meaningful way. But let's press on anyway!
RTFM: Direct Connect Interface?
After reading the datasheet and that article, I was left with the impression that "Direct Connect Interface" (DCI) is the name of some Intel-specific transport layer that carries debug signals between the target system and a host machine.
This apparently works on-top of existing USB2 or USB3 interfaces on the target machine. The documentation mentions that DCI can be used in several different configurations, and I'm still not 100% certain about all of the distinctions made by the documentation.
My takeaways from this are:
-
On older parts, DCI.OoB works "out-of-band" over USB and requires a special adapter to sit between the target and the host machine
-
On newer parts, DCI.DbC works by exposing a "Debug Class" (DbC) USB host and does not require an adapter, although it does require a special USB Type-A to Type-A cable without the
VBUSpins
I thought that this machine should be new enough to support DCI.DbC, and it seems like the next logical step is to try and enable it somehow. Based on some of the other articles I found, it seems like enabling DCI.DbC probably requires patching our BIOS to some degree. On the surface, our BIOS setup menu doesn't expose any options for enabling this.
I was kind of optimistic, so I pre-emptively ordered one of these cables in case we can manage to figure it out.
RTFM: USB Debug Class?
I'm not especially knowledgeable about USB, but since we're going to be linking up two USB ports, the controller on the target machine needs to know [somehow] that it should act like a "USB device" rather than a "USB host".
Under normal circumstances, you can't connect two Linux machines over USB
and expect anything useful to happen. Since USB also carries power, this is
kind of sketchy - that's why our special cable has the VBUS pins
disconnected. After receiving the cable, I decided to double-check this with
a multimeter.
I was curious about how this works, and I originally thought that use of DCI.DbC might require support for the similiarly-named-but-distinct xDCI (in contrast to xHCI), which is a kind of "dual-role" USB controller that can be configured to act as either a "device" or a "host."
However, after looking at the USB Debug Class Specification3, it seems like this capability is already handled by host controllers that support DbC:
The Debug Class requires a USB device controller on the Target System. However, a host does not have a USB device controller, and thus needs extra logic so that it behaves as a device (and not a host) during debug over USB.
The xHCI specification defines the DbC Debug Capability for this purpose, where the DbC is in essence a simple device controller that provides a pair of Bulk endpoints for the purpose of debug. This allows, for example, a laptop to debug another laptop that supports DbC.
I took this to mean that enabling DbC is probably sufficient and that our host controller already has the appropriate logic inside. We probably don't have to worry about enabling xDCI (although, I ultimately decided to enable it anyway just in case).
Platform Configuration
Since we're inevitably going to be playing around with our UEFI firmware, it's probably useful to understand how this machine is configured.
The BIOS version on this device is ATJSLCPX.0037.2022.0715.1547, and I
decided to avoid updating the BIOS just in case it might make a difference.
Looking at the board itself, this device uses the
Winbond W25R128JV
SPI flash device, and it was easy to find the datasheet for this part online.
Asking CHIPSEC
chipsec is a pretty useful tool
that you can use to validate some aspects of the platform configuration
on Intel machines. I had to hack on the configuration files a little bit to
get the common.debugenabled module to work on this machine, but it was
all pretty straightforward.
In short, these are the bits of information that seemed relevant to me:
- Writes to the BIOS region in SPI flash are enabled only for SMM
- The "enable" bit in
IA32_DEBUG_INTERFACEis actually set to 1 - DCI is not currently enabled (and presumably neither is DbC)
Before looking at the firmware in any detail, I spent a bit of time trying to verify that it wasn't possible to write EFI variables from Linux or the UEFI shell, and quickly realized that this seemed to be accurate.
Unfortunately, this means that even if we find some useful hidden BIOS settings that we might want to change, it isn't going to be easy for us to do that from software.
Some UEFI BIOS implementations (including this one) apparently include drivers running in System Management Mode (SMM) that expose a mailbox which can be used to request changes to BIOS settings, or to trigger a BIOS update during runtime. I wouldn't be suprised if you could use something like this to do everything from software, but I didn't want to inflict a bunch of pain on myself by trying to understand how it works.
Asking MEI
Apart from this, it's also useful for us to understand how the Converged Security and Management Engine (CSME) has been configured on this machine, since this has some bearing on what security features might be enabled on the platform.
On platforms with CSME, you can read out some details about the platform state by interacting with the "Management Engine Interface" (MEI) exposed via MMIO. On this machine, the MEI reports the following:
- The CSME version on this device is
13.50.20.1673 LP Consumer - This machine is not in "manufacturing mode"
- The fuse for "disable CPU debugging" has not been burned
- The fuse for "flash descriptor verification" has not been burned
- The fuse for an OEM public key has been burned
- Boot Guard is enabled
It's nice to see that CPU debugging hasn't been completely disabled, although, I'm not entirely sure what this means. Is that fuse referring to the x86 cores, or to the core inside the CSME?
Since Boot Guard is present [and the machine has actually left manufacturing mode], this means that our firmware image is signed with the OEM's private key. Even if we have control over the contents of SPI flash, there are certain regions that we cannot modify without causing the boot process to fail during verification. We'll have to check this later.
Glasgow: なんでもできる!
Since it seems like we cannot easily patch our BIOS from software, we need some way to interact with the SPI flash chip directly. I don't have one of those SPI flash programmers, but I do have the Glasgow Digital Interface Explorer. This is essentially an FPGA with a friendly Python toolchain that makes it very easy to reconfigure the device in order to interact with different kinds of hardware.
Luckily for us, the software already has support for SPI flash programming. I picked up one of those SOIC test clips and wired everything up:
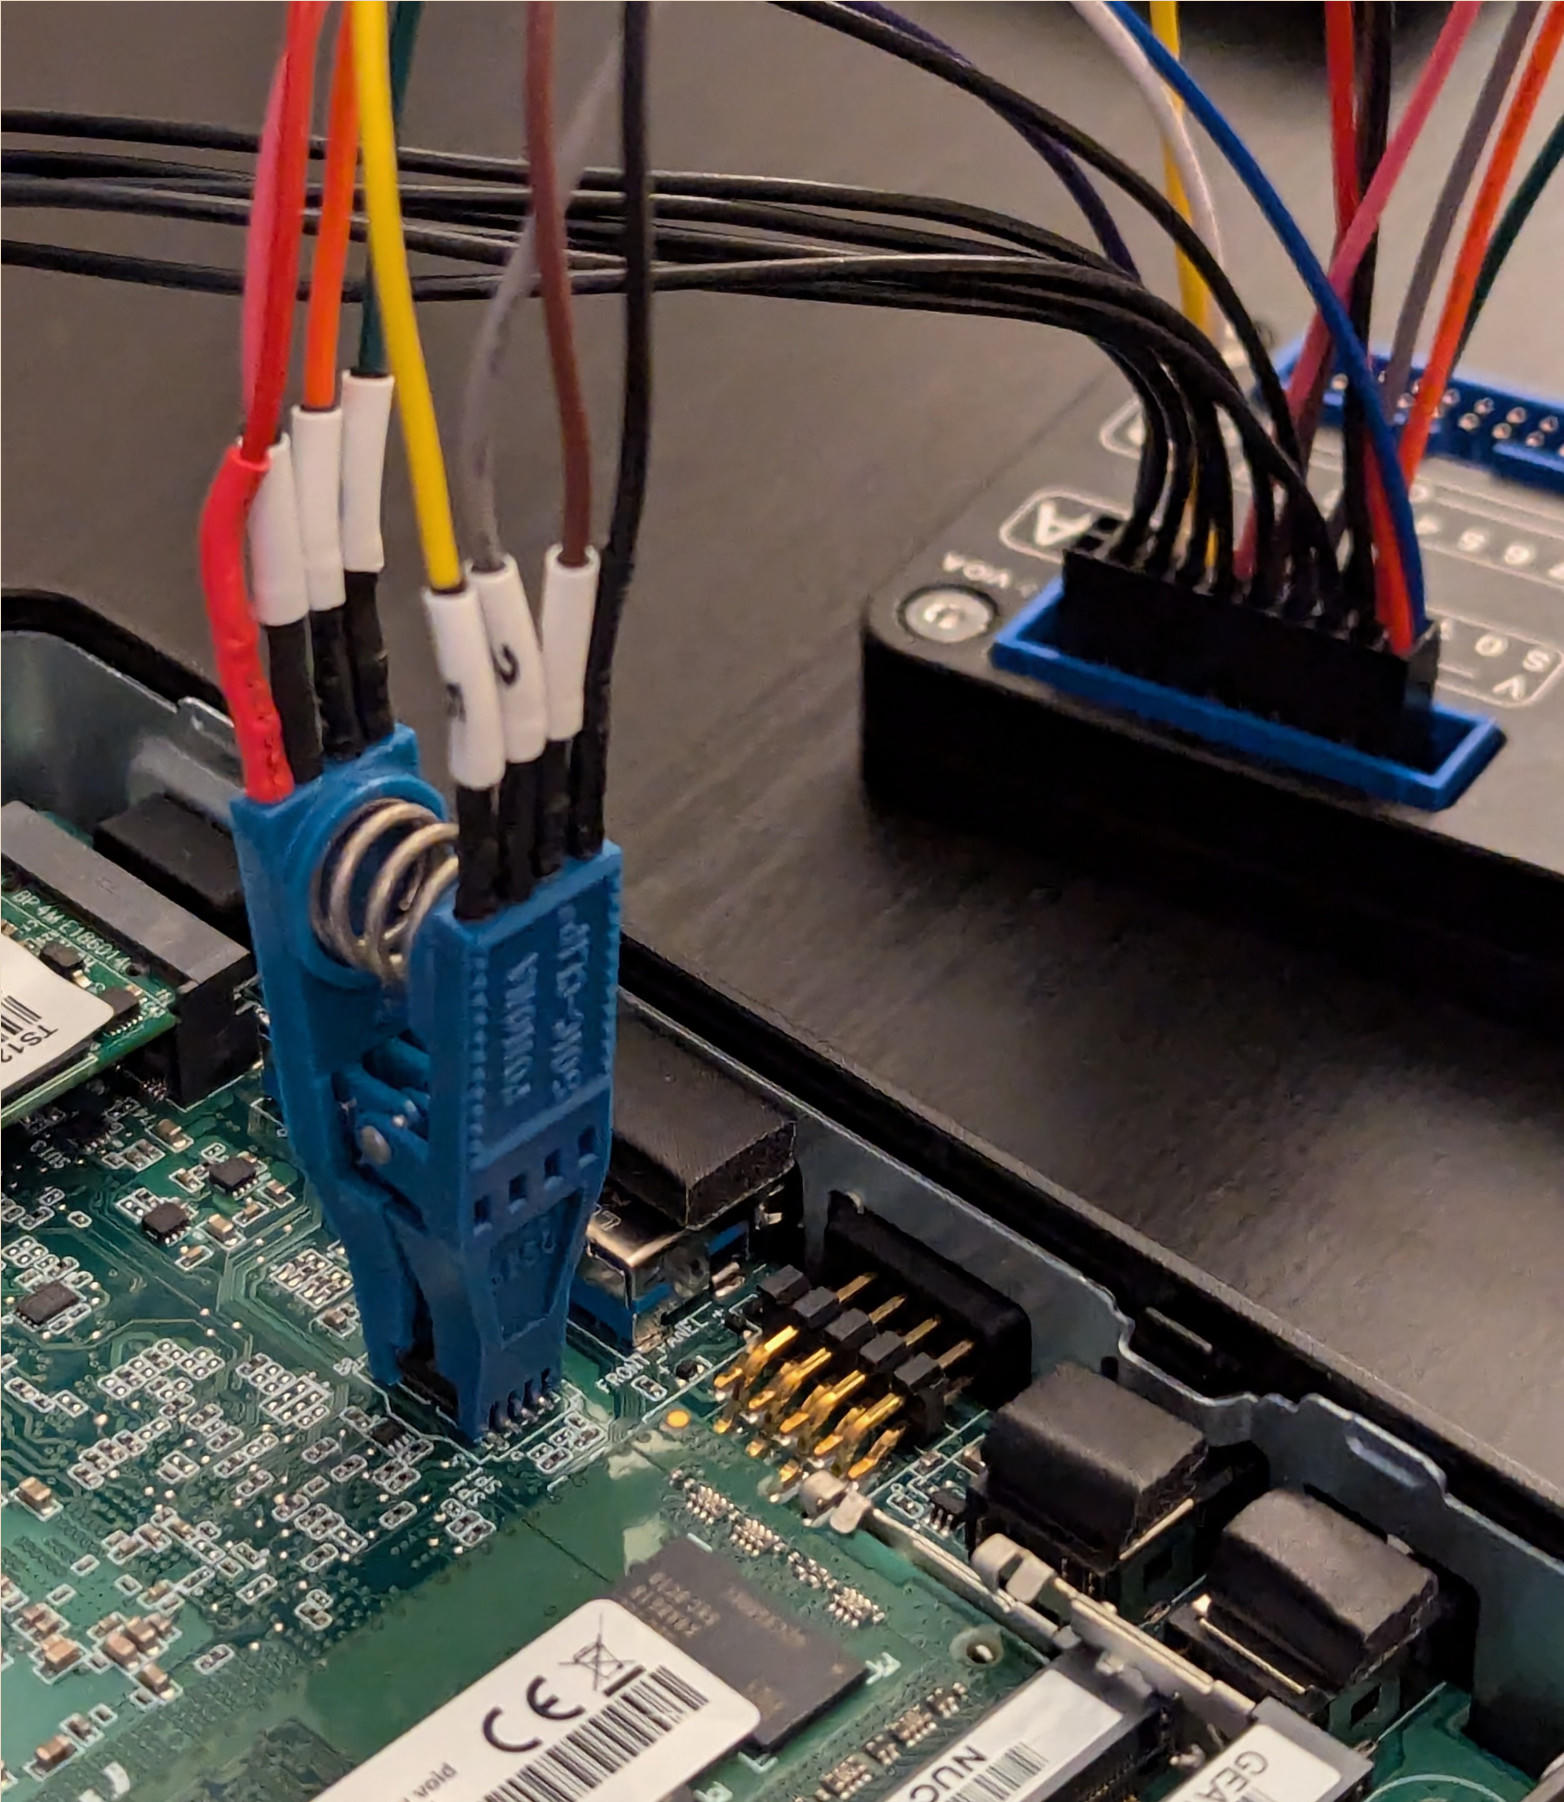 Figure 2. Glasgow wired up to the W25R128JV SPI flash on the device
I was very pleased that it immediately seemed to
recognize the device, and that the memory-25x applet already implements most
of what we'll need to do here. Until now, I haven't had the chance to use an
external SPI flash programmer, so I thought all of this was pretty neat.
$ glasgow run memory-25x -V 3.3 --port A \
    --pin-sck 0 --pins-io 1,2,3,4 --pins-cs 5 \
    identify

I: g.device.hardware: generating bitstream ID 7ee2a39fc3ebbca58488dfbb9782d4d7
I: g.cli: running handler for applet 'memory-25x'
I: g.applet.memory.25x: port(s) A, B voltage set to 3.3 V
I: g.applet.memory.25x: JEDEC manufacturer 0xef (NEXCOM) device 0x17 (8-bit ID)
I: g.applet.memory.25x: JEDEC manufacturer 0xef (NEXCOM) device 0x4018 (16-bit ID)
I: g.applet.memory.25x: device has valid SFDP 1.6 (JESD216B) descriptor
I: g.applet.memory.25x:   SFDP table #0: JEDEC, Flash Parameter Table 1.6 (JESD216B)
I: g.applet.memory.25x:     density (Mebibits)     : 128
I: g.applet.memory.25x:     density (Mebibytes)    : 16
I: g.applet.memory.25x:     address byte count     : 3
I: g.applet.memory.25x:     write granularity      : 64 byte(s)
I: g.applet.memory.25x:     sector sizes           : 4096, 32768, 65536
I: g.applet.memory.25x:     sector size 4096       : erase opcode 0x20
...
At this point, we should probably take an image of the device before doing
anything more risky (although in retrospect, I could have done this earlier in
software with chipsec or flashrom):
$ glasgow run memory-25x -V 3.3 --port A \
    --pin-sck 0 --pins-io 1,2,3,4 --pins-cs 5 \
    fast-read -f /tmp/dump.bin 0 $((0x1000000))
I: g.device.hardware: generating bitstream ID c6f2820ec30e3991084b8e620fcf66fd
I: g.cli: running handler for applet 'memory-25x'
I: g.applet.memory.25x: port(s) A voltage set to 3.3 V
...

$ xxd -l 0x100 /tmp/dump.bin
00000000: 1100 009c 9002 00d6 0000 0005 ffff ffff  ................
00000010: 5aa5 f00f 0300 0400 0802 102a b001 0300  Z..........*....
00000020: 0000 0000 ffff ffff ffff ffff ffff ffff  ................
00000030: f5fc 5812 2142 60ad b7b9 c4c7 ffff ffff  ..X.!B`.........
00000040: 0000 0000 0006 ff0f 0100 ff05 ff7f 0000  ................
00000050: ff7f 0000 ff7f 0000 ff7f 0000 ff7f 0000  ................
00000060: ff7f 0000 ff7f 0000 ff7f 0000 ff7f 0000  ................
00000070: ff7f 0000 ff7f 0000 ff7f 0000 ff7f 0000  ................
00000080: 000f a000 000d 4000 ffff ffff 0000 0000  ......@.........
00000090: 0001 0110 0000 0000 ffff ffff ffff ffff  ................
000000a0: ffff ffff ffff ffff ffff ffff ffff ffff  ................
000000b0: ffff ffff ffff ffff ffff ffff ffff ffff  ................
000000c0: ffff ffff ffff ffff ffff ffff ffff ffff  ................
000000d0: ffff ffff ffff ffff ffff ffff ffff ffff  ................
000000e0: ffff ffff ffff ffff ffff ffff ffff ffff  ................
000000f0: ffff ffff ffff ffff ffff ffff ffff ffff  ................
The magic bytes at offset 0x10 here are telling us that we're looking at
the Intel flash descriptor region. This probably indicates that we're actually
reading valid data from the device!
After playing around for a while, I originally thought that this device had some kind of restrictive write protection configured by the platform. Luckily, this wasn't the case, and I just needed a reminder about how SPI flash typically works: you actually need to erase sectors before programming them!
In order to avoid having to write over the entire flash image, I decided to try patching individual 4KiB sectors. In my case, the process I used for writing data back to the device looked something like this:
# Erase a particular sector
$ glasgow run memory-25x -V 3.3 --port A \
        --pin-sck 0 --pins-io 1,2,3,4 --pins-cs 5 \
        erase-sector <sector address>
...

# Write over a particular sector with a 4KiB file [using 256B pages]
$ glasgow -v run memory-25x -V 3.3 --port A \
        --pin-sck 0 --pins-io 1,2,3,4 --pins-cs 5 \
        program -P 256 -f <4KiB patch file> <sector address>
...

# Read the data back after programming
$ glasgow run memory-25x -V 3.3 --port A \
        --pin-sck 0 --pins-io 1,2,3,4 --pins-cs 5 \
        read -f /tmp/verif.bin <sector address> $((0x1000))
...

# Sanity check to verify that we've actually programmed the sector
$ sha1sum <4KiB patch file> /tmp/verif.bin
...
I think the memory-25x applet actually has a single command for performing
all of this at once, but I decided [for no reason in particular] to do it all
separately.
"Fun" with UEFI Images
Since we know that Boot Guard is enabled, we probably want to exercise caution
when writing back to the device. When we plug our image into
uefitool, it tells us that
Boot Guard should be verifying all of the EFI executables used in the boot
process. This means that we aren't going to be able to patch any UEFI code
without breaking the device.
However, it looks like Boot Guard is not responsible for verifying the contents of the NVRAM volumes used to store EFI variables. Luckily for us, this is how BIOS settings are implemented on UEFI platforms.
Decompiling IFR
In UEFI BIOS, the logic for the setup menu is typically compiled into some
kind of bytecode called "Internal Forms Representation" (IFR). This usually
lives in the data segments of the EFI executable for the BIOS setup menu.
The driver is usually called Setup, and the GUID is
899407D7-99FE-43D8-9A21-79EC328CAC21.
With a copy of our firmware on hand, we can use uefitool and
ifrextractor
to easily decompile this and recover more information about the BIOS setup menu.
Most importantly, this tells us about the actual storage locations for
individual BIOS settings. Each option is ultimately stored at some offset
within an EFI variable that lives in the BIOS region on our SPI flash.
The output from ifrextractor shows these as VarStore entries at the top.
Here's a few that will be relevant to us later:
EC87D643-EBA4-4BB5-A1E5-3F3E36B20DA9, VarStoreId: 0x1, Size: 0xB6B, Name: "Setup"
B08F97FF-E6E8-4193-A997-5E9E9B0ADB32, VarStoreId: 0x2, Size: 0x1B0, Name: "CpuSetup"
72C5E28C-7783-43A1-8767-FAD73FCCAFA4, VarStoreId: 0x5, Size: 0x30F, Name: "SaSetup"
4570B7F1-ADE8-4943-8DC3-406472842384, VarStoreId: 0x6, Size: 0x694, Name: "PchSetup"
AAF8E719-48F8-4099-A6F7-645FBD694C3D, VarStoreId: 0xA, Size: 0x7, Name: "SiSetup"
...
And here's what the entry for our "Debug Interface" option looks like.
This option is stored as a single byte in VarStoreId: 0x1 (that's the
Setup UEFI variable) at offset 0xa2c:
OneOf Prompt: "Debug Interface", Help: "Enable/Disable Debug Interface Support",
QuestionFlags: 0x10, QuestionId: 0x4E, VarStoreId: 0x1, VarOffset: 0xA2C,
Flags: 0x10, Size: 8, Min: 0x0, Max: 0x1, Step: 0x0
	OneOfOption Option: "Disabled" Value: 0, Default, MfgDefault
	OneOfOption Option: "Enabled" Value: 1
End
Now, if we look inside the Setup variable on the NVRAM volume in our flash
dump, we should be able to verify that this byte is already set to 0x01.
uefitool says that this variable lives at offset 0x632867 in our flash
dump, and that the header is 10 bytes.
$ xxd -l $((0xb6b)) -o -$((0x623867 + 0xa)) -s $((0x623867 + 0xa)) dump.bin
00000000: 0100 0000 0101 0001 0101 0001 0100 0101  ................
00000010: 0000 0000 0001 0201 0101 0002 0100 0100  ................
00000020: 0000 0002 0000 0000 0100 0000 0002 0102  ................
00000030: 0100 0000 0000 0000 0000 0101 0001 0101  ................
...
                                      right here!
                                        vv
00000a20: 0000 0000 0000 0000 0000 0001 0100 0000  ................
00000a30: 0000 0000 0000 0000 0000 0000 0000 0000  ................
00000a40: 0000 0000 0000 0000 0000 0000 0000 0000  ................
...
You could also verify this with efivarfs on Linux (or dmpstore in the UEFI
shell), which is another way of
looking at the EFI variables on a running system. In efivarfs, each of the
entries apparently has a 4-byte header describing some attributes for the
variable, so you might want to skip over it when reading the data, ie.
$ xxd -o 4 -s 4 \
    /sys/firmware/efi/efivars/Setup-ec87d643-eba4-4bb5-a1e5-3f3e36b20da9
Turning Some Knobs
Combing through the IFR shows a ton of BIOS options that are simply not present in the setup menu at all, and after thinking about it for a while, I decided on modifying the following options:
Variable |Option                      |Off   |Target Value
---------+----------------------------+------+---------------------
Setup    |"Debug Interface"           |0xa2c |0x01 (Enabled)
---------+----------------------------+------+---------------------
PchSetup |"xDCI Support"              |0x046 |0x01 (Enabled)
PchSetup |"PCH Trace Hub Enable Mode" |0x630 |0x02 (Host Debugger)
PchSetup |"Lock PCH Sideband Access"  |0x656 |0x00 (Disabled)
PchSetup |"DCI Enable"                |0x658 |0x01 (Enabled)
PchSetup |"USB DbC Enable Mode"       |0x659 |0x02 (USB3)
---------+----------------------------+------+---------------------
CpuSetup |"CPU Run Control"           |0x0e2 |0x01 (Enabled)
CpuSetup |"CPU Run Control Lock"      |0x0e3 |0x00 (Disabled)
---------+----------------------------+------+---------------------
SaSetup  |"CPU Trace Hub Enable Mode" |0x08b |0x02 (Host Debugger)
---------+----------------------------+------+---------------------
SiSetup  |"Platform Debug Consent"    |0x001 |0x03 (USB3 DbC)
Most of these are mentioned in other similar articles about enabling debugging with DCI, but here's a quick overview of my rationale behind some of these:
-
"Debug Interface" is enabled in an attempt to tell the platform that we consent to enabling debug features
-
"xDCI Support" probably shouldn't be necessary since the host controller will be using DbC, but I decided to enable it just in case it makes some kind of difference
-
"Lock PCH Sideband Access" might not be necessary, but I wanted it disabled so that I could check whether or not DCI is enabled during runtime (since the DCI registers aren't exposed directly over MMIO, you need to perform indirect accesses on them with the sideband interface)
-
"DCI Enable" is enabled in an attempt to enable DCI
-
"USB DbC Enable Mode" is enabled in an attempt to enable DbC over USB3
-
"Platform Debug Consent" is enabled in an attempt to tell the platform that we consent to enabling DCI.DbC over USB3
-
"CPU Run Control" is enabled (and "CPU Run Control Lock" is disabled) in an attempt to enable the use of run control
-
"PCH Trace Hub Enable Mode" and "CPU Trace Hub Enable Mode" are enabled in an attempt to enable any tracing features that might be available
I was kind of weary of the fact there were also options that seemed related to clock-gating and "overcurrent enablement" for USB3 when DbC is being used. For better or worse, I decided to avoid playing with these and left them alone.
I haven't had any catastrophic problems [so far?], but it's not clear to me whether or not changes to these are actually required. You could probably verify this by spending some time and reversing whichever EFI modules are responsible for applying all of these options, but I didn't attempt to look into it any further.
Patching the Flash Descriptor
Like I mentioned briefly before, there's an Intel-specific "flash descriptor" region that lives at the very start of our SPI flash image. This contains a bunch of information about how the SPI flash is partitioned into different regions.
On top of that, there are also various platform-specific "soft-straps" which are values used to initialize certain aspects of the hardware. I assumed that these are applied somewhat earlier in the boot process [relative to the normal "end-user visible" changes to BIOS configuration], but I don't actually know that for certain. The soft-straps are apparently configured by the OEM, or by whoever is responsible for building/integrating binaries into the final UEFI firmware image.
After investigating for a while, I determined that the PCH soft-straps for this image include a single bit which enables the use of DCI for debugging. After finding the appropriate offset, I decided to patch this bit before patching all of the other EFI variables in NVRAM.
Intuition suggests there's a good chance that this is necessary for enabling DCI, but I didn't go out of my way to verify whether or not this is the case. I actually forgot to test this independently of my other patches to the BIOS configuration in NVRAM.
Also, there doesn't seem to be a lot of information about the "flash descriptor verification" feature on these platforms, and I was sort of apprehensive about doing this despite the fact that it seems to be disabled on this particular machine.
Patching EFI Variables in NVRAM
After rebooting, I was happy that I hadn't managed to immediately brick the machine, and I needed a way to create patches for the EFI variables that I decided to change.
This ended up being a simple Python script that reads the original image, computes all of the offsets to the target data, and then spits out the appropriate 4KiB patches that I can apply using the Glasgow. It's nothing special, but here's what that looks like in practice:
...
p = FlashImage(argv[1])

# These are the entries in 'AmiStandardDefaultsVariable'.
# SiSetup and SaSetup are not actually present in NVRAM as EFI variables
# (presumably because they come from the FSP and they're never actually
# changed at runtime during normal operation?)
p.decl_nvar("SaSetup-default",  base_addr=0x600E82, header_size=0x13, body_size=0x30f)
p.decl_nvar("SiSetup-default",  base_addr=0x6018EA, header_size=0x13, body_size=0x7)
p.decl_entry("SiSetup-default", "platform_debug_consent", 0x1)
p.decl_entry("SaSetup-default", "cpu_trace_hub_enable_mode", 0x8b)

# These are actual EFI variables that store options from the BIOS setup menu
p.decl_nvar("CpuSetup", base_addr=0x601C0B, header_size=0x14, body_size=0x1b0)
p.decl_nvar("PchSetup", base_addr=0x601DCF, header_size=0x14, body_size=0x694)
p.decl_entry("CpuSetup", "cpu_run_control", 0xe2)
p.decl_entry("CpuSetup", "cpu_run_control_lock", 0xe3)
p.decl_entry("PchSetup", "bios_lock", 0x1c)
p.decl_entry("PchSetup", "xdci_support", 0x46)
p.decl_entry("PchSetup", "pch_trace_hub_enable_mode", 0x630)
p.decl_entry("PchSetup", "lock_pch_sideband_access", 0x656)
p.decl_entry("PchSetup", "dci_enable", 0x658)
p.decl_entry("PchSetup", "usb_dbc_enable_mode", 0x659)

# Apply whatever patches we need
p.patch_entry("CpuSetup", "cpu_run_control", 0x01) # "Enabled"
p.patch_entry("CpuSetup", "cpu_run_control_lock", 0x00) # "Disabled"
p.patch_entry("PchSetup", "pch_trace_hub_enable_mode", 0x02) # "Host Debugger"
p.patch_entry("PchSetup", "lock_pch_sideband_access", 0x00) # "Disabled"
p.patch_entry("PchSetup", "xdci_support", 0x01) # "Enabled"
p.patch_entry("PchSetup", "dci_enable", 0x01) # "Enabled"
p.patch_entry("PchSetup", "usb_dbc_enable_mode", 0x02) # "Enabled (USB3)"
p.patch_entry("SiSetup-default", "platform_debug_consent", 0x3) # "Enabled (USB3 DbC)"
p.patch_entry("SaSetup-default", "cpu_trace_hub_enable_mode", 0x2) # "Host Debugger"

# Write back to disk
p.dump_patches()
One strange thing I realized was that the SaSetup and SiSetup variables
didn't seem to be present in the NVRAM region like the others. I thought this
was probably because they're defined by the Jasper Lake firmware support
package (FSP) integrated into the BIOS image.
My impression was that most of the options defined by the FSP aren't meant to change unless the entire image is being updated, and that most of the options are "baked-in" when the FSP is being integrated into the whole image.
At first this seemed like a deal-breaker, but after checking again, uefitool
showed me that they are technically present in NVRAM. On my machine, these
were wrapped up inside a different variable named AmiStandardDefaultsVariable.
I didn't have any real evidence that the machine was using these to apply the
configuration, but without any other solution, I decided to patch them along
with the other variables.
Success?
After rebooting again, I was happy to see chipsec report that DCI appears
to be enabled!
[+] loaded chipsec.modules.common.debugenabled
[*] running loaded modules ..

[*] Running module: chipsec.modules.common.debugenabled
[x][ =======================================================================
[x][ Module: Debug features test
[x][ =======================================================================

[*] Checking IA32_DEBUG_INTERFACE MSR status
[*] IA32_DEBUG_INTERFACE = 0xC0000001 << Silicon Debug Feature Control (MSR 0xC80 Thread 0x0)
    [00] ENABLE           = 1 << Enable
    [30] LOCK             = 1 << Lock (set automatically on the first SMI)
    [31] DEBUG_OCCURRED   = 1 << Debug Occurred (set by hardware)
[-] CPU debug enable requested by software.
[!] Debug Occurred bit set in IA32_DEBUG_INTERFACE MSR
...

[*] Checking DCI register status
[*] ECTRL = 0x0000B9D1 << DCI Control Register (msgbus port 0xB8, off 0x4)
    [00] LOCK             = 1 << Host DCI enable bit lock
    [04] ENABLE           = 1 << Host DCI enable
[-] DCI Debug is enabled

[*] Module Results:
[!] IA32_DEBUG_INTERFACE.DEBUG_OCCURRED bit is set.
[!] IA32_DEBUG_INTERFACE.ENABLE bit is set.
[-] FAILED: One or more of the debug checks have failed and a debug feature is enabled
After using the cable to attach to one of the front USB3 ports on the NUC,
I was greeted with the following output from dmesg (note that 8087 is
Intel's USB vendor ID!):
$ dmesg
...
[ 2569.692989] usb 8-1: new SuperSpeed USB device number 2 using xhci_hcd
[ 2569.709813] usb 8-1: LPM exit latency is zeroed, disabling LPM.
[ 2569.709895] usb 8-1: New USB device found, idVendor=8087, idProduct=0a79, bcdDevice= 0.00
[ 2569.709901] usb 8-1: New USB device strings: Mfr=0, Product=0, SerialNumber=0

$ lsusb
...
Bus 008 Device 002: ID 8087:0a79 Intel Corp.
I thought this was a good result, and I decided that this was a good stopping point. Maybe in the future, we can return to this and try to understand whether or not the run control features are actually enabled and usable.
Resources and Footnotes
Similar Blog Posts
Satoshi Tanda: "Debugging System with DCI and Windbg"
Andrey Konovalov: "Unlocking secret Thinkpad functionality for emulating USB devices"
Teddy Reed: "Debug UEFI code by single-stepping your Coffee Lake-S hardware CPU"
Nicholas Starke: "Modifying BIOS using RU.efi"
Useful Tools
Glasgow Digital Interface Explorer
LongSoft/IFRExtractor-RS
LongSoft/UEFITool
chipsec/chipsec