Speculating on Zen 2 (Part 1)
Table of Contents
This is the first part of my exploration into branch prediction and speculation in the Zen 2 microarchitecture, where I introduce a lot of context and present some tests with conditional branches.
Just a heads up: I can't explain all of this from first principles because it would be a lot, and this has already turned out to be pretty long. I'll try my best not to make any huge leaps, but there will probably be some technical language and ideas that I'll assume you already have some familiarity with:
- At least a bit of experience dealing with the x86-64 instruction set
- Some understanding about principles in modern computer architecture
- Some idea about how superscalar, out-of-order machines are organized
If you think anything could be explained better (or you find anything I've gotten plainly wrong!), feel free to bother me about it. You can find code from this article at eigenform/lamina-zen2-spec.
Motivation and Context
Branch prediction and speculation have been the subject of intense scrutiny in security research over the past couple of years. In short, these are both strategies for exploiting parallelism in programs, and they're very important in most modern general-purpose machines.
One of the common patterns in this kind of research involves:
-
Reliably causing the machine to take carefully-crafted speculative paths via branch mispredictions
-
Using the resulting transient instructions (meaning "mispredicted and speculative" instructions) to leave side-effects on a shared resource (i.e. caches or parts of the microarchitectural state)
-
Turning these effects into a side-channel, with the goal of leaking information between different privilege domains in the machine
I'm already a bit familiar with Zen 2 machines, and in light of recent research (i.e. from VUSec1, Grsecurity23, Intel STORM4), I decided it'd be interesting to try my own exploration into the ideas underlying all of this:
- What does it take to reliably speculate into code that we control?
- How are branch predictors implemented in modern machines anyway?
- What kinds of boundaries constrain transient instructions?
I might not get to all of them, but we can at least start by searching for the same mechanism described above: some kind of setup that we can use to consistently cause branch mispredictions. This will let us explicitly cause speculation of some other target code. After that, we're free to explore the behavior of transient instructions under more controlled conditions.
To make things a little simpler, we'll restrict ourselves to situations on only a single hardware thread. Then, instead of looking for side-effects in unexpected places, we can look in places where transient instructions are expected to leave effects: the performance-monitoring counters (PMCs).
PMC Events on Zen 2
PMCs are a useful architecturally-defined5 interface for exploring the behavior of machines. The AMD Processor Programming Reference (PPR)6 documents define the different microarchitectural events that you can count with the PMCs on Zen 2 machines.
On the surface, there are not many speculatively-counted events. Reading through the descriptions of different events, you'll find that the only events explicitly labeled as "speculative events" are:
- PMCx02d: "Time Stamp Counter Reads"
- PMCx040: "Data Cache Accesses"
- PMCx04b: "Prefetch Instructions Dispatched"
- PMCx08a: "L1 Branch Prediction Overrides Existing Prediction"
- PMCx08b: "L2 Branch Prediction Overrides Existing Prediction"
- PMCx08e: "Dynamic Indirect Predictions"
- PMCx091: "Decoder Overrides Existing Branch Prediction"
Of course, it's likely that there are many more events, and that AMD has simply decided to leave them undefined in the PPRs7. Despite this, we at least have a few options. What can we use to help us determine whether or not we've speculatively executed some code?
There are lots of different ways of accomplishing this, but in this case, I
chose the event for dispatched PREFETCH instructions. This is mostly because
PREFETCH is decoded to only a single micro-op, and because it probably
won't be used by other [unrelated] code that might affect our measurements.
In this way, we can be fairly certain that our target code being speculated is
the only thing that could possibly be dispatching PREFETCH instructions and
incrementing the counter.
I should also mention that there are many other (not necessarily speculative) PMC events that I might use to help illustrate things later. As you'd expect, these are usually used for counting things relevant to performance monitoring: branch mispredictions, different types of instructions or micro-ops moving through the machine, cache accesses, idle clock cycles, and so on.
Measuring Branch Instructions
It sounds a little strange, but since we're trying to cause consistent
speculation down mispredicted paths, this means that our target code needs
to be totally unreachable under normal conditions. We also want our target
code to contain a PREFETCH instruction, so that we can check the PMCs to
determine if any speculation occured.
The simplest setup should take the following form, where we try out different types of branches, and then allow them to jump over our speculated target code. I'll be using this general layout:
start:
    jmp branch_target

    // Speculated target code
    prefetch [rdi]
    lfence

branch_target:
    ...
end:
    ...
I'm using eigenform/lamina to assemble these tests in-memory, execute them, and then collect results from the PMCs. You can read more about that library in one of my previous articles, see "Instrumenting PMCs on Zen 2 Machines".
The body of a test will be wrapped up in a Rust macro which emits code for reading the PMCs and setting up some initial state:
// A macro for assembling a test
macro_rules! emit_branch_test {
    ($ptr:ident $($body:tt)*) => { {

        // 'lamina' wrapper macro for RDPMC measurements.
        // Most general-purpose registers have been cleared.
        // The PMCs are enabled and counting events inside this block.
        emit_rdpmc_test_all!(

            // A pointer to pass to the PREFETCH instruction
            ; mov rdi, QWORD $ptr as _

            // Compute the effective address of these two labels that
            // we expect to define in the body of our test.
            // This will make testing indirect branches a little easier.
            ; lea rsi, [->branch_target]
            ; lea rbx, [->end]

            // Clear RAX [and set the zero flag].
            ; xor rax, rax

            // Stop any speculative paths from entering our test code
            ; lfence

            // The body of our test is inserted here at compile-time
            $($body)*

            // Stop any speculative paths from escaping our test code
            ; lfence
        )
    } }
}
Despite the fact that we've taken some measures to ensure that our initial architectural state ("programmer-visible" state) will be mostly uniform every time we run this code, we're ultimately concerned about measuring things that depend on microarchitectural state, which is largely abstracted away from our control. No matter what we do, running the test might have an effect on future tests.
On top of this, we're also measuring these events in Linux userspace. This means it's fairly likely that for some test runs, the CPU core executing this code may take an interrupt, or otherwise start executing in some other thread with code that we're not interested in measuring.
Letting our measurement run many times in a row seems like the only reasonable solution here. This lets us capture any differences that might occur [over time]. However, even though the relationships between different test runs might encode something interesting, distinguishing between signal and noise may involve some critical thinking on our part.
Luckily, there's at least one property of our tests that should be invariant. For instance, every time we run a test, the number of retired branching instructions should be consistent with the number of reachable branches that we've actually written in our test body. Since our test is only a very small chunk of code, this property is easy to prove by hand.
I'll be using this strategy to sift out tests that might be noisy.
This is pretty easy for us to do manually because there's also a PMC event
(ExRetBrn) for counting the number of retired branch instructions.
With all this in mind, the whole process for a test will be a loop with the following steps:
- Run a test some number of times:
- Enable the PMCs with events events we're interested in
- Enter the body of our test
- Let the code run (and increment the PMCs)
- Disable the PMCs and read the results
- If we recorded more retired branches than expected, we probably need to try running the test again
Before we start running these tests, there's another crucial point that we
have to consider: the instruction set does present us with some ways of
ensuring that the pipeline can be put into a partially-known state. This is
why our code above includes an LFENCE instruction at a few particular points.
About the LFENCE Instruction
Usually, LFENCE is a marker in the x86 ISA used to serialize
the order in which load operations are completed with respect to one another.
However, in our test code, there are no load instructions!
LFENCE on Zen 2 is typically dispatch-serializing.
This means that instructions proceeding the LFENCE are dispatched to the
back-end part of the machine only after the LFENCE has retired (or in other
words, after LFENCE has become the oldest instruction in the machine).
This whole dispatch-serializing property is part of AMD's "post-silicon" workaround89 for vulnerabilities involving speculation on Zen 2: it gives programmers some extra guarantees/degrees of control over the state of the out-of-order pipeline at any particular point in time.
In this way, LFENCE indicates a point or boundary in the program where
speculative dispatch (and any subsequent speculative execution) should
not be permitted to cross.
In our case, we want to make sure we're only observing events caused by speculative dispatch/execution inside the body of our test. Then once the machine is finally executing inside the body of our test, we want to restrict speculation to only our target code residing down some mispredicted path.
A Brief Taxonomy (of Branches)
Branching instructions in x86 fall into the following categories:
-
Branches may be conditional or unconditional
- Unconditional branches are always taken
- Conditional branches are determined to either taken or not-taken after some condition is evaluated in the back-end of the machine
-
Branches may be direct or indirect
- Direct branches encode the target address as an immediate value
- Indirect branches resolve a target address by reading the architectural state (i.e. memory, or a general-purpose register)
-
Some branches are calls or returns
- Calls are special unconditional branches that may be direct or indirect, where the next-sequential address (the return address) is saved onto the stack
- Returns are special unconditional indirect branches, where the target address is the return address saved on the stack by a previous call
We'll be using these terms a lot to talk about branches, so I thought it was worth throwing this in here. With that out of the way, it's about time we started running some tests.
Testing a Conditional Branch
First off, let's look at the behavior of a conditional branch which is
always taken. Since our template code always sets the zero flag, it's easiest
to just write a JZ instruction (for "jump if zero").
The setup looks like this:
// Set of [up to six] PMC events we're going to measure
let events = PerfCtlDescriptor::new()
    // PREFETCH instructions [speculatively] dispatched
    .set(0, Event::LsPrefInstrDisp(0x01))
    // Retired mispredicted branches
    .set(1, Event::ExRetBrnMisp(0x00))
    // Retired branches
    .set(2, Event::ExRetBrn(0x00));
ctx.write(&events)?;

// 'emit_branch_test!()' is the macro I described earlier.
// This is the body of our test.
let code = emit_branch_test!(scratch_ptr
    // The zero flag is always set entering this gadget.
    // That means this branch is always taken.
    ; jz ->branch_target

    // Unreachable [speculated] code
    ; prefetch [rdi]
    ; lfence

    // Actual branch target
    ; .align 64
    ; ->branch_target:
    ; ->end:
);

// Generate the test and run it some number of times
let mut test = PMCTest::new("jcc always-taken", &code, &events);
test.run_iter(4096);
With a little bit of Python and matplotlib, all we need are some simple
line graphs to show how many events we captured each test run:
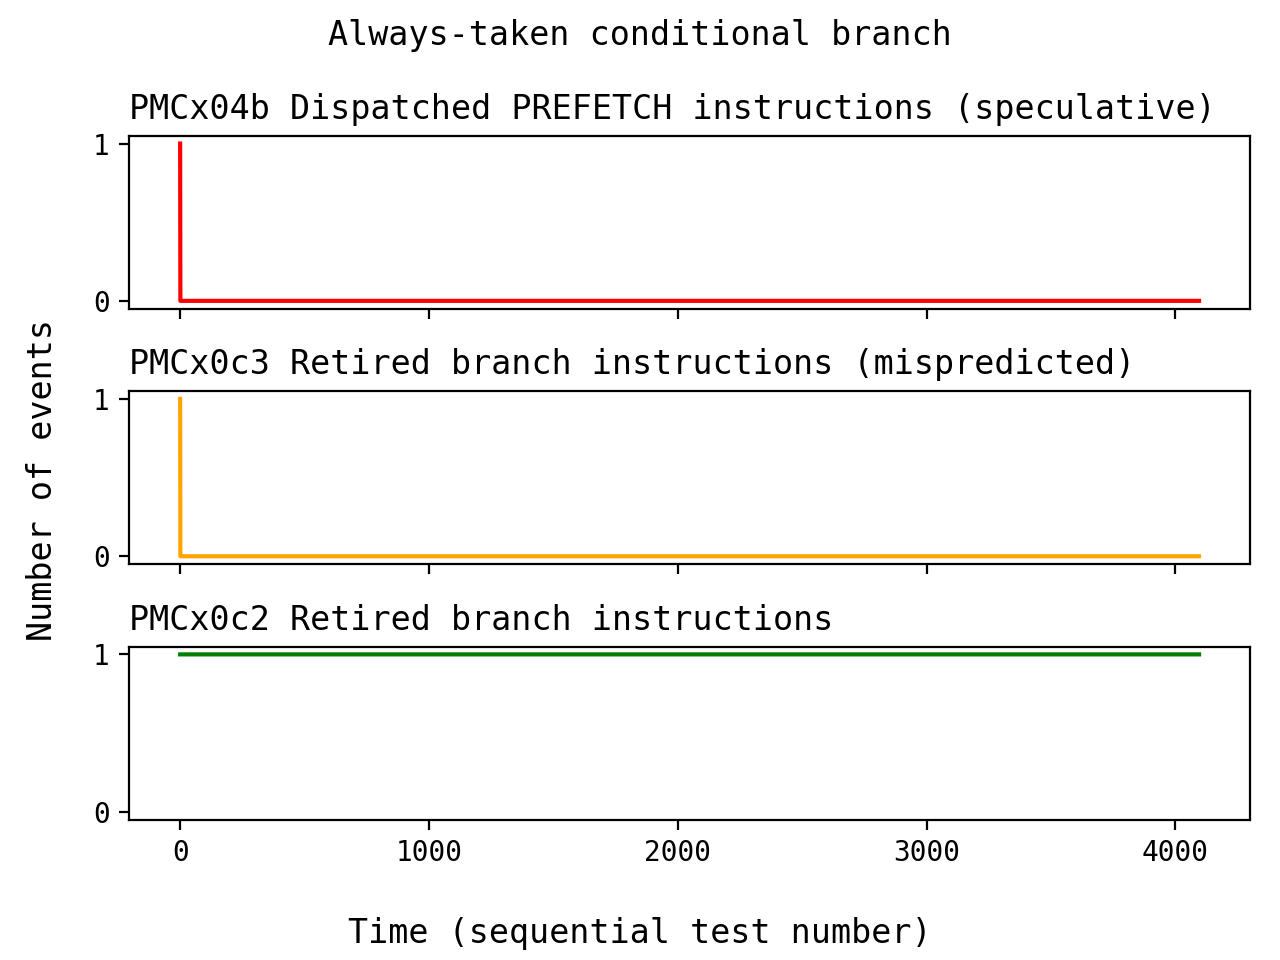
Remember that our target block is never executed architecturally, but despite this, we see a single prefetch event! Also, notice that we observed a single branch misprediction at the same time. These results happen consistently every time I run the set of tests. Since the misprediction only happens once at the beginning of each set of test runs, it seems clear that:
- The branch predictor always initially predicts this branch to be not-taken, and then speculates into our unreachable code
- The machine then realizes this as a misprediction, learns the correct direction, and immediately stops trying to speculate for the rest of the tests
This naturally leads into a test for the opposite case: what happens when we
use the JNZ instruction instead, creating a branch which is never taken?
    let code = emit_branch_test!(scratch_ptr
        // This branch is never taken and always falls through
        // to the next 'jmp' instruction.
        ; jnz ->branch_target

        // Jump directly to the end of the test.
        ; jmp ->end
        ; lfence

        // Unreachable [speculated] code
        ; .align 64
        ; ->branch_target:
        ; prefetch [rdi]
        ; lfence

        ; .align 64
        ; ->end:
    );
This code looks slightly different because our speculated block needs
live at the branch_target label instead of following sequentially after the
JNZ instruction. We need that extra JMP instruction to exit the test,
and the following LFENCE should stop us from potentially speculating through
a path other than "predicting the branch as taken."
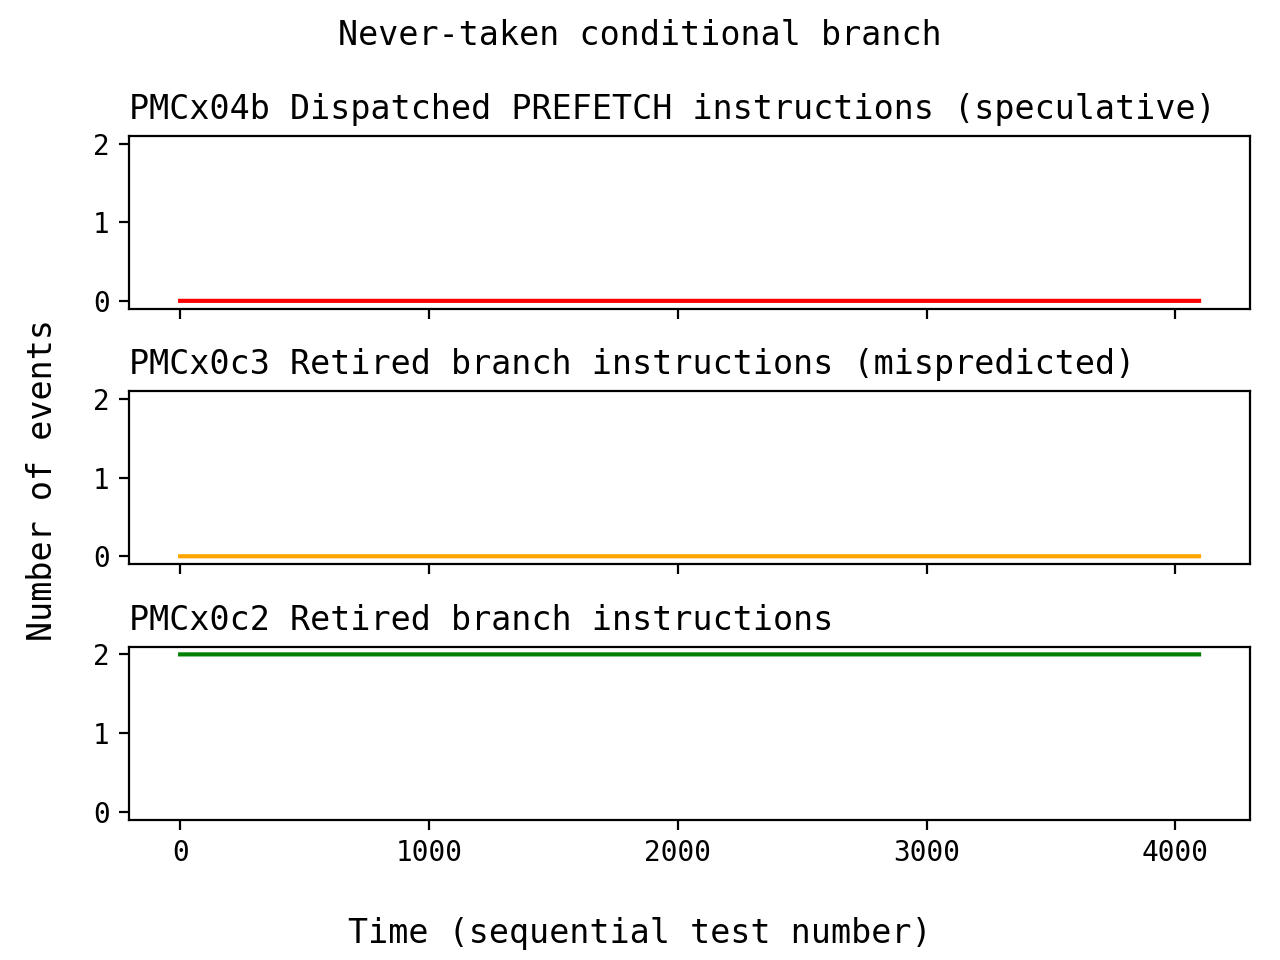
Now, we see no mispredictions, and no PREFETCH events. Running this set of
tests many times shows that this is consistently the case. This is a little
bit suprising: the branch predictor never tries to predict this branch as
taken.
So far, observing conditional branches has taught us:
- Always-taken branches are always [initially] predicted not-taken
- Never-taken branches are never predicted taken
But why is this the case? At this point, we need to start doing a bit of
research into how the Zen 2 branch predictor is implemented. I had to avoid
talking about this at the outset (for the impact), but this should also explain
why I've decided to scatter all of those .align 64 statements inside our
tests.
About the Branch Predictor
The good news is that we aren't completely left in the dark here: AMD keeps a bit of documentation about the branch predictor (and the microarchitecture) in the Software Optimization Guide (SOG)10.
The Branch Target Buffer
As far as I can tell, much of the branch prediction logic on Zen 2 revolves around a Branch Target Buffer (BTB). This is essentially a kind of cache for branches and their targets, where the entries are tagged by the addresses of instruction fetch blocks (64-bytes on Zen 2). BTBs are a common feature in modern machines with branch prediction.
The SOG mentions that each entry can record information about one branch in the block, or two if the first branch in a block is conditional. Each entry stores the resolved target address of a branch, plus some other information specific to the particular kind of branch.
At some point (presumably when a branch instruction is decoded), a prediction depends on whether or not the fetch block containing the branch hits in the BTB, and whether or not the branch has been recorded in the BTB entry. If a BTB entry exists for a branch, the target address in the entry is used to make a prediction.
This was the reasoning behind the use of .align 64 in our tests: branch
predictor behavior relies a bit on how our code is aligned with respect to
cache lines. Keeping branches and branch targets in distinct cache lines will
make things a little easier when we need to start reasoning about predictions
and how they're related to BTB entries.
Predicting Conditional Branches
Looking at the SOG, it's clear that the branch predictor is best considered as a few different interdependent pieces. Some parts are only responsible for helping make predictions about particular kinds of branches, and other parts are responsible for managing the act of branch prediction in general.
Since we started looking at conditional branches, let's review some of the language from the SOG about the "Conditional Branch Direction Predictor":
"Conditional branches that have not yet been discovered to be taken are not marked in the BTBs. These branches are implicitly predicted not-taken."
"Conditional branches are predicted as always-taken after they are first discovered to be taken."
These statements seem to perfectly characterize what we've seen so far. For our test with the "always-taken" conditional branch:
- Initially, there's no BTB entry for the branch, and the machine implicitly predicts "not-taken"
- Then, the branch is architecturally resolved to be "taken", and the machine learns that the initial prediction was a misprediction
- To correct this, the machine creates a new BTB entry for the branch, which will be used to predict "taken" using the target address every time the branch is encountered in the future
- Since the branch is always resolved to be taken for the rest of our test runs, the machine continues to correctly predict "taken" using the cached target address from the BTB entry
This also matches our observation for the "never-taken" conditional branch:
- Initially, there's no BTB entry for the branch, and the machine implicitly predicts "not-taken"
- The branch is architecturally resolved to be "not-taken", meaning the prediction was correct!
- This prediction is always correct for all subsequent test runs because the branch is always resolved to be "not-taken"; the machine doesn't need a BTB entry to correctly predict the branch
From this, we can extract another interesting bit of information: if mispredicting an "always-taken" branch depends on the presence of a BTB entry, it should technically be possible to coerce our "always-taken" branch into mispredicting every time, so long as we have some way of ensuring that no BTB entry exists when the branch is encountered in the instruction stream11.
"Dynamic" Conditional Branches
These are both exceptional cases of conditional branches in the sense that they always resolve to the same direction. In most cases, we'd typically expect the direction of a conditional branch to vary while a program is running. The SOG has a little bit to say about this too:
"Only branches that have been previously discovered to have both taken and fall-through behavior will use the conditional predictor. The conditional branch predictor uses a global history scheme that keeps track of the previously executed branches. Global history is not updated for not-taken branches."
"For this reason, dynamic branches which are biased towards not-taken are preferred. Branch behavior which depends on deep history or which does not correlate well with global history will be mispredicted often."
"Conditional branches that are in the always-taken state are subsequently changed to the dynamic state if they are subsequently discovered to be not-taken, at which point they are eligible for prediction with the dynamic conditional predictor."
The SOG doesn't explicitly mention this, but it seems like the BTB sits in front of all this logic. In other words, BTB entries need to be created first before any of these heuristics using global history are applied for making a prediction. In order for this to happen, the machine has to observe that a branch has been resolved in the "taken" direction.
Returning to our original goals: I decided that I didn't want to think about how we might go about consistently mispredicting a dynamic conditional branch, mostly because it seems like too much effort. If it's even possible at all, the strategy there probably involves training the conditional predictor in some very roundabout way12.
Fitting into the Pipeline
Branch prediction is mostly relevant to the front-end of the pipeline. We observed earlier that the BTB is directly related to instruction fetch because the entries are indexed by [64B-aligned] fetch addresses.
Apart from all the talk about different structures within the branch predictor, the SOG also has some information about how predictions are related to other parts in the front-end of the machine.
Fetch Addresses
The SOG describes some next-address logic that determines the input to instruction fetch:
"When no branches are identified in the current fetch block, the next-address logic calculates the starting address of the next sequential 64-byte fetch block. This calculation is performed every cycle to support the 64 byte per cycle fetch bandwidth of the op cache."
"When branches are identified, the next-address logic is redirected by the branch target and branch direction prediction hardware to generate a non-sequential fetch block address."
In the absence of branch instructions, the default behavior is to continue by fetching the next-sequential cache line.
Prefetch Behavior
On Zen 2, predictions are also used to prefetch data from far memories into the L1 instruction cache:
"On misses, the L1 instruction cache generates fill requests for the naturally-aligned 64-byte block that includes the miss address and up to thirteen additional blocks. These blocks are prefetched from addresses generated by the Branch Predict unit."
It wasn't obvious to me at first, but this is actually one reason why we've observed that "taken" branches seem to be asymetrically more-important to the branch predictor than "not-taken" branches: effective prefetching!
Remember that "taken" branches [typically] jump somewhere else, and that "not-taken" branches fall through to the next-sequential instruction. Since the hardware prefetcher is directed with predicted target addresses, this means that it's more efficient to generate predictions for "taken" branches because branch targets are more likely to be non-local, and less likely to be in the L1 instruction cache13.
Fetch Windows
The SOG also mentions a fetch window tracking structure which seems to preserve the set of all fetch blocks that are moving through the pipeline at any given point in time:
"Each entry holds branch and cacheline information for up to a full 64-byte cacheline."
"If the fetch window tracking structure becomes full, instruction fetch stalls until instructions retire from the retire control unit or a branch misprediction flushes some entries."
There isn't much information about this, although there are some SOG documents for older machines (i.e. Family 15h) that refer to this as the "BSR".
Making a Diagram
Diagramming is a practice I often use for thinking about things. This one will be simplified [and maybe a little inaccurate], but I think it's still useful to be able to see a hypothesis about how things move through the machine, and how different parts appear to be related.
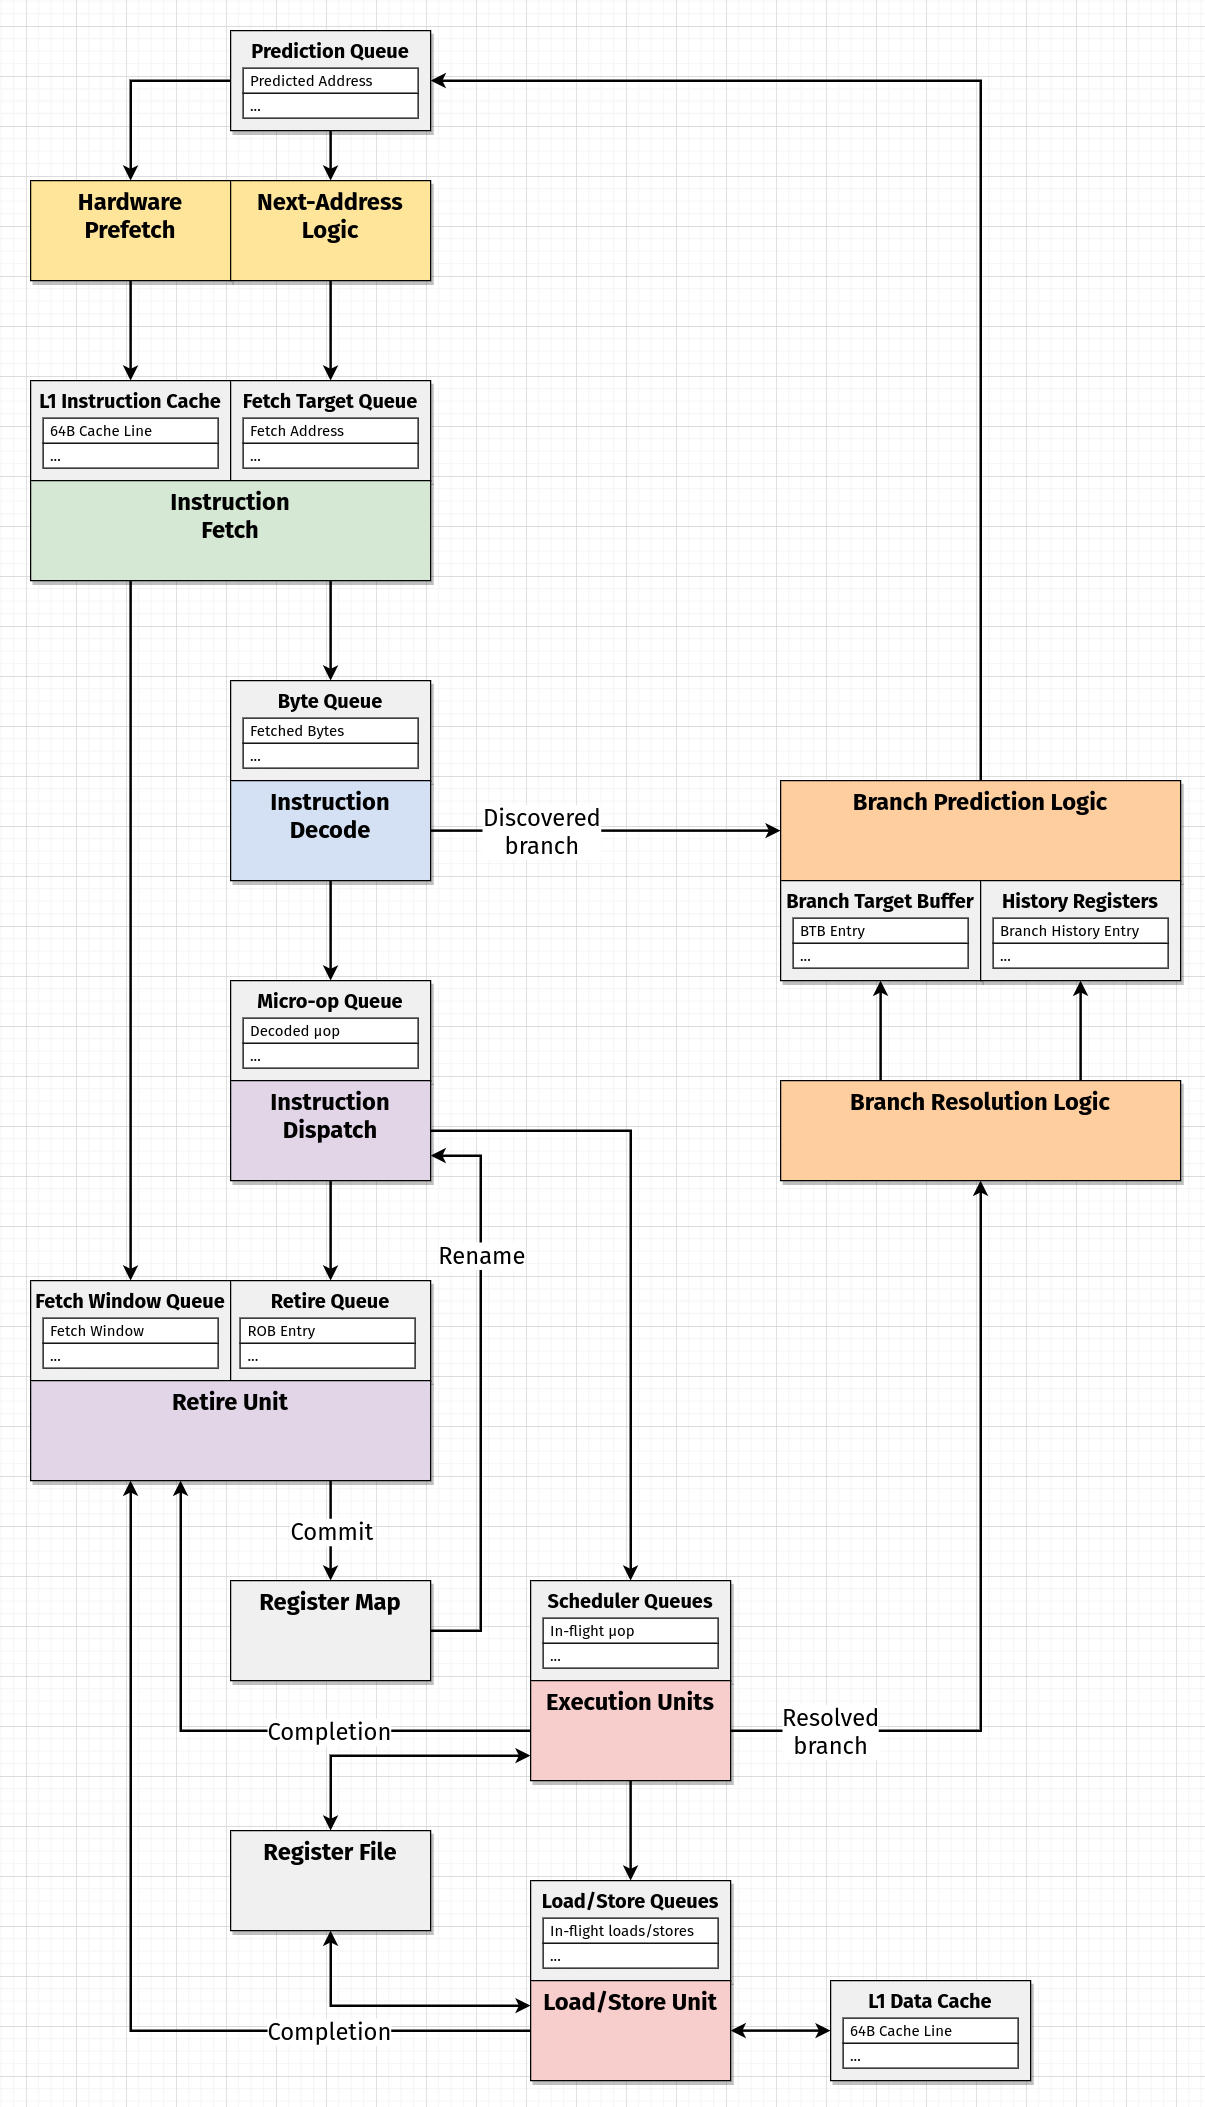
In this case, I thought it was useful to highlight the distinction between processes (colored blocks) and state (grey blocks). The directed edges between them loosely represent where data is moving. Time isn't explicitly shown in this diagram because all of these processes are [in the ideal case] occuring in parallel.
We haven't talked about [and probably won't talk about] all the parts in this diagram, but I think including them makes it easier to get a feeling for places where certain actions are decoupled from one another. We'll probably refer to this diagram and revise it later if things become any clearer.
Breakpoint
I decided to cut this whole article into multiple pieces.
In the next part, I'll present more tests for other remaining types of branching instructions. We'll also look closer at other pieces of the branch predictor, and continue trying to make some sense of the whole picture.
Resources and Footnotes
The x86 ISA defines special registers (a set of "model-specific registers", or MSRs) that are reserved for this purpose, although the specific set of events varies across different machines and vendors. Most other modern ISAs also include features similar to this!
Despite this, there's nothing stopping you from simply selecting undefined events and seeing what happens. For the record, there are quite a few undefined events. I decided to avoid incorporating this into my experiments here, mostly for for the sake of brevity. Exploring in that direction is on my to-do list.
Meaning, this should be configured on all up-to-date machines. AFAICT, this is usually set up by UEFI firmware at boot-time on Zen 2 (i.e. by applying the relevant microcode patch and setting some chicken-bit in an MSR somewhere).
This Grsecurity article2 is an excellent write-up about this case, and I decided to avoid exploring it here - Pawel presents a whole mechanism for BTB flushing, and then goes on to build some actual examples of side-channels using eBPF programs in the kernel.
I saw the section about the conditional predictor on WikiChip14 and decided that I didn't want to open that can of worms.
This whole part confused me for a while, and then YouTube actually recommended me this extremely-relevant video15 out of the blue.